









Marketing teams now collect data from almost every customer interaction. Website visits, search traffic, advertising campaigns, email engagement, social media activity, leads, conversions, and customer journeys all contribute to a growing amount of marketing data.
The challenge is not simply collecting this information. The real challenge is understanding it.
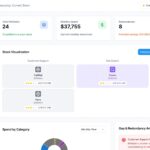
This is where Martech reporting tools become valuable. They help marketers bring data from different platforms into dashboards, monitor important metrics, identify performance trends, and understand how marketing activities contribute to business goals.
However, not every reporting tool is designed for the same purpose. Some are better suited to digital marketing dashboards, while others focus on CRM reporting, cross-channel analytics, client reporting, or advanced business intelligence.
So, which Martech reporting tools can provide the most useful insights?
The answer depends on your data sources, marketing objectives, reporting requirements, and the level of analysis your team needs.
What Are Martech Reporting Tools?
Martech reporting tools are platforms that collect, organize, visualize, and analyze marketing data from different sources.
Depending on the platform, marketers can connect information from:
- Google Analytics
- Google Ads
- Search Console
- Social media platforms
- CRM systems
- Email marketing platforms
- Marketing automation software
- Advertising platforms
- Ecommerce systems
- Customer databases
Instead of checking every platform individually, marketers can use reporting dashboards to view important information in one place.
A well-designed reporting system should do more than display numbers. It should help marketers understand what happened, identify changes in performance, and determine where further investigation is needed.
Why Are Martech Reporting Tools Important?
Marketing data is often scattered across multiple platforms. A company might use one system for SEO, another for paid advertising, another for email marketing, and a CRM for customer information.
Managing all this information manually can become time-consuming.
Martech reporting tools can help teams:
- Centralize marketing information
- Monitor important KPIs
- Reduce manual reporting work
- Compare marketing channels
- Identify performance trends
- Track campaign results
- Improve data visibility
- Share reports with stakeholders
For example, instead of simply seeing that website traffic increased, a marketing team can investigate which channel generated that traffic and whether those visitors contributed to leads or conversions.
What Should You Look for in a Martech Reporting Tool?
Choosing a reporting platform should not be based only on the number of features it offers. The tool should match your actual reporting requirements.
1. Data Integrations
A useful reporting platform should connect with the systems your marketing team already uses.
Common integrations include:
- Google Analytics
- Google Ads
- Search Console
- CRM platforms
- Email marketing tools
- Social media platforms
- Ecommerce systems
The more easily your data can be connected, the less manual work your team may need to perform.
2. Customizable Dashboards
Different teams need different information.
A marketing manager may want campaign performance and conversion data, while an executive may only need high-level information about leads, revenue, and acquisition costs.
Customizable dashboards make it easier to present the right information to each audience.
3. Automated Reporting
Manual reporting can take hours, particularly when marketers have to export information from several platforms.
Automated reporting can help reduce repetitive work by pulling information into predefined dashboards or reports.
4. KPI Tracking
The platform should make important marketing KPIs easy to monitor.
Depending on your goals, these could include:
- Website traffic
- Leads
- Conversion rate
- Cost per lead
- Customer acquisition cost
- Return on ad spend
- Revenue
- Engagement
- Pipeline value
5. Trend and Performance Analysis
A good reporting process should allow teams to compare performance over time.
For example, marketers can compare:
- Week-over-week performance
- Month-over-month performance
- Campaign performance
- Channel performance
- Current versus previous periods
This makes it easier to identify significant changes instead of looking at individual numbers in isolation.
Top Martech Reporting Tools to Consider
Different reporting platforms serve different purposes. The following tools can support different types of marketing reporting and analysis.
1. Google Looker Studio
Google Looker Studio is a popular option for creating interactive dashboards and visual reports.
It can connect with several Google marketing and analytics products, including Google Analytics, Google Ads, and Search Console, along with other data sources.
Best suited for:
- SEO dashboards
- Website reporting
- Google Ads reporting
- Marketing KPI dashboards
- Custom visualizations
One of its advantages is flexibility. Marketers can create dashboards based on the metrics and data sources that matter to their campaigns.
However, more advanced cross-platform reporting may require additional connectors or data preparation.
2. HubSpot Reporting
HubSpot provides reporting capabilities across marketing, sales, CRM, and customer data.
For organizations already using HubSpot, this can make it easier to connect marketing activity with contacts, lifecycle stages, campaigns, and sales information.
Best suited for:
- Lead reporting
- CRM reporting
- Campaign performance
- Customer lifecycle analysis
- Marketing and sales reporting
- Pipeline analysis
The ability to connect marketing information with CRM data can be useful for businesses that want to understand the relationship between campaigns and customer progression.
3. Databox
Databox focuses on performance dashboards and KPI monitoring.
It can bring information from different data sources into dashboards, allowing marketing teams to monitor important metrics without checking every platform separately.
Best suited for:
- KPI dashboards
- Performance monitoring
- Marketing reporting
- Goal tracking
- Multi-source dashboards
It can be useful for teams that want a straightforward way to monitor important marketing numbers.
4. AgencyAnalytics
AgencyAnalytics is designed with agencies and client reporting requirements in mind.
Marketing agencies often work with multiple clients and need to combine SEO, advertising, social media, and other marketing metrics into clear reports.
Best suited for:
- Client reporting
- SEO reporting
- PPC reporting
- Social media reporting
- Agency dashboards
- Automated reports
Its agency-focused approach can help reduce repetitive reporting work when managing multiple accounts.
5. Whatagraph
Whatagraph focuses on marketing performance reporting and cross-channel dashboards.
It can help teams bring information from different marketing channels into centralized reports.
Best suited for:
- Cross-channel reporting
- Marketing dashboards
- Campaign reporting
- Client reports
- Automated marketing reports
This type of reporting can be particularly useful when marketers manage several channels and want to view campaign performance from one location.
6. Microsoft Power BI
Microsoft Power BI is a broader business intelligence platform that can also be used for marketing analytics.
It can be useful when marketing information needs to be analyzed alongside sales, finance, operations, or other business data.
Best suited for:
- Business intelligence
- Enterprise reporting
- Advanced analytics
- Custom dashboards
- Large datasets
Power BI can provide more advanced analytical capabilities, although teams may need additional technical knowledge to build and maintain complex reporting environments.
7. Tableau
Tableau is a business intelligence and data visualization platform that can support advanced marketing analysis.
It allows teams to explore data and create customized visualizations and dashboards.
Best suited for:
- Advanced analytics
- Complex datasets
- Data visualization
- Enterprise reporting
- Detailed data exploration
Tableau may be more appropriate for organizations with dedicated analysts or more advanced data requirements.
Martech Reporting Tools Comparison
| Reporting Tool | Main Strength | Suitable For |
|---|---|---|
| Looker Studio | Flexible dashboards | Digital marketing and Google data |
| HubSpot | CRM and marketing reporting | Leads, campaigns, and customer data |
| Databox | KPI monitoring | Marketing performance dashboards |
| AgencyAnalytics | Client reporting | Marketing agencies |
| Whatagraph | Cross-channel reporting | Campaign and channel reporting |
| Power BI | Business intelligence | Enterprise analytics |
| Tableau | Advanced visualization | Complex data analysis |
The comparison shows why there is no single reporting platform that fits every marketing team. The right choice depends on the organization’s data environment and reporting goals.
How to Choose the Right Martech Reporting Tool
Before selecting a reporting platform, consider the following questions.
What Marketing Data Do You Need?
Start by listing the platforms your team already uses.
For example:
- Analytics platforms
- Advertising platforms
- CRM
- Email marketing software
- Social media
- SEO tools
- Ecommerce platforms
Then determine whether the reporting tool can connect to these systems.
Who Will Use the Reports?
Consider who will actually read the dashboards.
Marketing specialists may need detailed campaign information, while senior management may prefer a simple overview of leads, revenue, and acquisition costs.
A reporting platform should make it possible to present information at the appropriate level.
How Much Manual Reporting Do You Do?
If your team spends several hours every week collecting data and creating spreadsheets, automation may be an important consideration.
Reducing repetitive reporting tasks can allow marketers to spend more time analyzing results and improving campaigns.
Do You Need Marketing Analytics or Business Intelligence?
A marketing-focused reporting platform may be sufficient if your main goal is monitoring campaigns and channels.
However, organizations that want to combine marketing data with sales, finance, customer service, and operational information may need a broader business intelligence platform.
Do You Need Attribution Reporting?
Marketing journeys often involve several touchpoints.
A customer may discover a company through organic search, interact with an advertisement, read an email, and later convert through a direct visit.
A basic reporting dashboard may show these channels separately. More advanced analytics may be required to understand how multiple interactions contributed to the final conversion.
How to Get Better Insights From Martech Reporting
A reporting tool alone does not guarantee useful insights. The way you structure your reporting process also matters.
Focus on Business Goals
Avoid creating dashboards filled with unnecessary metrics.
Start with your marketing objective and choose KPIs that directly support it.
For lead generation, you might track:
- Qualified leads
- Conversion rate
- Cost per lead
- Customer acquisition cost
- Pipeline contribution
For content marketing, you may focus on:
- Organic traffic
- Engagement
- Landing-page conversions
- Returning visitors
- Content-assisted conversions
Connect Marketing Activity With Outcomes
Traffic and engagement are useful measurements, but they do not always show the complete business impact.
A stronger reporting structure can connect:
Campaign → Visitor → Lead → Opportunity → Customer → Revenue
This provides a clearer view of how marketing activity contributes to business outcomes.
Look for Changes and Patterns
Do not only report the current numbers.
Look for changes that raise useful questions.
For example:
Organic traffic increased, but conversions decreased.
That observation could lead the marketing team to investigate whether the additional traffic came from lower-intent searches or whether conversion pages need improvement.
This is more useful than simply reporting a traffic increase.
Build Dashboards for Different Teams
A single dashboard may not work for everyone.
You can create separate reporting views for different audiences.
Executive Dashboard
- Revenue
- Leads
- Pipeline
- Customer acquisition cost
- Overall marketing performance
Marketing Dashboard
- Campaign performance
- Channel performance
- Conversions
- Cost per acquisition
- Engagement
SEO Dashboard
- Organic traffic
- Search clicks
- Impressions
- Search visibility
- Organic conversions
Content Dashboard
- Content traffic
- Engagement
- Landing-page performance
- Content conversions
This approach keeps reports focused and easier to understand.
Common Martech Reporting Mistakes
Even a powerful reporting platform can produce poor insights if the underlying reporting process is weak.
Tracking Too Many Metrics
More data does not automatically mean better analysis.
Choose metrics that are connected to your marketing objectives.
Using Inconsistent Definitions
Different teams may define terms such as “lead,” “conversion,” or “qualified lead” differently.
Consistent definitions are important for reliable reporting.
Ignoring Data Quality
Incorrect tracking codes, duplicate records, missing conversion events, and inconsistent campaign naming can affect reporting accuracy.
Before making decisions from a dashboard, check whether the underlying data is reliable.
Depending on One Attribution Model
No single attribution approach explains every customer journey perfectly.
Consider the buying process, sales cycle, and available data before interpreting attribution results.
Final Thoughts
Martech reporting tools have become an important part of modern marketing operations. They help teams bring scattered data together, monitor KPIs, automate reporting, and understand campaign performance.
However, the most suitable tool depends on the organization’s needs.
Looker Studio can support flexible marketing dashboards, while HubSpot is useful for organizations that want marketing and CRM reporting in the same ecosystem. Databox focuses on KPI monitoring, while AgencyAnalytics and Whatagraph can support agency and cross-channel reporting. Organizations with broader analytics requirements may consider platforms such as Power BI or Tableau.
The goal should not simply be to create more reports.
The goal is to create reports that answer meaningful marketing questions.
When marketers combine reliable data, relevant KPIs, clear dashboards, and thoughtful analysis, Martech reporting becomes more than a collection of numbers. It becomes a practical way to understand marketing performance and identify opportunities for improvement.
Frequently Asked Questions
1. What is Martech Reporting?
Martech Reporting is the process of collecting and analyzing marketing data from different platforms to understand campaign performance, track KPIs, and identify useful marketing insights.
2. What are the benefits of using Martech Reporting tools?
Martech Reporting tools can bring data into centralized dashboards, reduce manual reporting work, monitor KPIs, compare marketing channels, and help teams identify performance trends.
3. Which data can Martech Reporting tools analyze?
Depending on the platform, Martech Reporting tools can analyze data from analytics platforms, advertising channels, CRM systems, email marketing platforms, social media, SEO tools, and ecommerce systems.
4. How do I choose the right Martech Reporting tool?
Choose a Martech Reporting tool based on your data sources, reporting goals, required integrations, dashboard needs, automation requirements, and the level of analysis your marketing team needs.