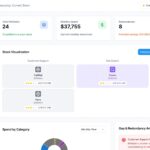










Marketing has become a numbers-driven business. From the moment someone discovers a brand to the time they become a customer, there are countless interactions that can be measured.
A person might find your website through Google, read a blog, click an email, interact with a social media post, download a resource, and eventually contact your sales team. Every one of those actions creates data.
The challenge isn’t getting the data.
The challenge is understanding it.
Marketing teams often use several different tools for advertising, email campaigns, SEO, CRM, automation, website analytics, and customer engagement. Each platform produces its own reports, which can make it difficult to see the bigger picture.
This is where MarTech analytics and reporting becomes valuable.
Instead of looking at isolated numbers, businesses can connect marketing data, understand customer behavior, measure campaign performance, and identify where marketing efforts are actually contributing to growth.
What Is MarTech Analytics and Reporting?
MarTech analytics is the practice of collecting and analyzing data from the different technologies a business uses for marketing.
These technologies may include CRM platforms, marketing automation software, website analytics tools, advertising platforms, email systems, SEO tools, customer data platforms, and social media platforms.
Reporting is how those insights are presented to the people who need them.
A report might show campaign performance, website conversions, lead generation, customer acquisition costs, or revenue contribution. But a useful report should do more than display numbers.
It should help answer a simple question:
“What should we do with this information?”
For example, suppose one advertising campaign generates 2,000 leads while another generates only 500.
At first glance, the first campaign looks like the winner.
But what if only 10 of those 2,000 leads become customers, while 100 of the 500 leads from the second campaign become customers?
Without proper analytics, it is easy to invest more money in the wrong campaign.
That is why context matters as much as the numbers themselves.
Why MarTech Analytics Is Important
Good marketing decisions require more than creativity. They require evidence.
Analytics gives marketing teams that evidence.
It Shows What Is Actually Working
Marketing teams often run several campaigns at the same time. Without proper measurement, it can be difficult to know which campaigns deserve more attention.
Analytics can show which channels are generating traffic, leads, conversions, and revenue.
This allows marketers to spend more time and budget on activities that are producing meaningful results.
It Helps Reduce Wasted Marketing Spend
Not every campaign performs equally well.
Analytics can highlight campaigns that consume budget without producing enough value.
For example, if a paid advertising campaign has a high cost per acquisition while another campaign consistently brings in customers at a lower cost, the data gives marketers a reason to reconsider how the budget is distributed.
It Gives a Better Understanding of Customers
Customers rarely interact with a brand only once.
They may visit several pages, download content, open emails, interact with advertisements, and speak with sales before making a decision.
MarTech analytics helps businesses understand these interactions as part of a broader customer journey rather than treating every action as an isolated event.
Where Does MarTech Analytics Data Come From?
One of the biggest advantages of a connected MarTech environment is that data can come from multiple sources.
Website Analytics
Website analytics shows what visitors do after reaching your website.
You can analyze things such as:
- Where visitors come from
- Which pages they visit
- How they interact with content
- Which pages lead to conversions
- Where visitors leave
- Which devices they use
This information can help identify opportunities to improve both content and user experience.
CRM Data
CRM data adds an important business layer to marketing analytics.
Website analytics might tell you that someone filled out a contact form. CRM data can help you understand what happened afterward.
Did that person become a qualified lead?
Did the sales team contact them?
Did they become an opportunity?
Did they eventually become a customer?
That connection helps marketing teams move beyond counting leads and start measuring business impact.
Advertising Data
Paid advertising platforms provide information about impressions, clicks, spending, conversions, and other campaign activity.
When this information is combined with CRM and revenue data, marketers can better understand whether advertising is producing valuable customers rather than simply generating clicks.
Email Marketing Data
Email platforms provide another useful source of information.
Marketers can monitor:
- Deliverability
- Opens
- Clicks
- Engagement
- Unsubscribes
- Conversions
But the most useful measurement is often what happens after someone interacts with an email.
A click is good.
A qualified lead or purchase is better.
Which MarTech Metrics Should You Track?
There is no single set of metrics that works for every company.
A B2B software company and an online retailer may have completely different priorities.
The best approach is to start with your business goals and then select metrics that help measure those goals.
Awareness Metrics
These metrics help measure visibility.
Examples include:
- Impressions
- Reach
- Website visitors
- Brand searches
- Video views
- Social media engagement
These numbers can tell you whether your brand is reaching the right audience, but they should not be treated as proof of business success by themselves.
Engagement Metrics
Engagement metrics help you understand whether people are interacting with your marketing.
Examples include:
- Content engagement
- Email clicks
- Returning visitors
- Content downloads
- Time spent on important pages
- Social interactions
A useful insight comes from understanding which type of engagement leads to further action.
Conversion Metrics
Conversion metrics are closer to business outcomes.
They may include:
- Form submissions
- Demo requests
- Sign-ups
- Purchases
- Qualified leads
- Conversion rate
These metrics help answer whether your marketing is encouraging people to take the actions you want.
Revenue Metrics
For business leaders, revenue-related metrics are often the most important.
These may include:
- Customer acquisition cost
- Customer lifetime value
- Marketing-generated revenue
- Marketing-influenced revenue
- Pipeline contribution
- Marketing ROI
The goal is to create a clear connection between marketing activity and business results.
Understanding Marketing Attribution
One of the hardest questions in marketing is:
Which channel deserves credit for a conversion?
Imagine a potential customer discovers your company through organic search. A few days later, they read one of your articles. The following week, they receive an email and click through to your website. Later, they see a paid advertisement and finally request a demo.
Which channel generated the lead?
The answer isn’t always straightforward.
This is why marketers use attribution models.
Different models assign credit to customer interactions in different ways. Some focus heavily on the first interaction, some focus on the last interaction, while data-driven approaches use customer journey information to distribute credit.
Attribution can be useful, but it should not be treated as a perfect explanation of why someone purchased.
Customer decisions are influenced by many factors that cannot always be captured in a dashboard.
For important budget decisions, attribution works best when combined with other forms of measurement, such as experiments and incrementality analysis.
How AI Is Changing Marketing Analytics
AI is becoming an increasingly useful part of the marketing analytics process.
Traditionally, marketers would open a dashboard, look at the numbers, and try to identify what changed.
AI can help make that process faster.
For example, imagine your website conversion rate suddenly drops.
Instead of manually checking every report, an AI-assisted analytics system may help identify unusual changes in traffic sources, campaigns, landing pages, audience segments, or customer behavior.
AI can also help with:
- Finding unusual patterns
- Summarizing reports
- Identifying potential trends
- Comparing campaign performance
- Supporting forecasting
- Generating questions for further analysis
But there is an important limitation.
AI can identify patterns, but people still need to understand the business context.
A sudden drop in conversions might be caused by a campaign problem, a website issue, seasonality, a change in audience behavior, or something completely unrelated.
The strongest analytics teams use AI to speed up analysis while keeping humans responsible for important decisions.
The Growing Importance of First-Party Data
Marketing measurement is also becoming more dependent on data that businesses collect directly from their own audiences and customers.
This is known as first-party data.
Examples include:
- Website interactions
- Customer purchases
- CRM records
- Email engagement
- Form submissions
- Account activity
- Customer preferences
First-party data can help businesses build a clearer understanding of their own customers.
However, collecting customer data comes with responsibility.
Businesses need to think about consent, security, access controls, retention, and applicable privacy requirements.
A strong MarTech strategy isn’t simply about collecting as much data as possible.
It’s about collecting useful data responsibly.
How to Build a Better MarTech Reporting Strategy
You don’t need hundreds of dashboards to build a successful reporting system.
In fact, too many dashboards can make decision-making harder.
Start with a few simple steps.
1. Start With Business Goals
Before selecting metrics, decide what marketing is supposed to achieve.
Are you trying to:
- Generate more qualified leads?
- Increase sales?
- Improve customer retention?
- Reduce acquisition costs?
- Increase online purchases?
- Improve marketing ROI?
Your reporting strategy should reflect these goals.
2. Choose Meaningful KPIs
Once your goals are clear, choose the KPIs that help measure progress.
For example, if your primary goal is qualified lead generation, website traffic alone isn’t enough.
You may need to track:
Traffic → Leads → Qualified Leads → Opportunities → Customers
That gives you a much more useful view of performance.
3. Connect Your Data
Whenever possible, connect important marketing systems.
A typical setup could look like:
Website → Marketing Automation → CRM → Sales → Revenue
Advertising, email, SEO, and content data can then be connected to the same measurement framework.
4. Keep Your Data Clean
Bad data creates bad reports.
Common problems include duplicate contacts, missing tracking parameters, inconsistent campaign names, and different definitions of the same KPI.
Create clear naming conventions and regularly check your tracking.
5. Automate Repetitive Reports
If your team spends hours every week copying numbers from one platform to another, automation can save considerable time.
Automated reporting allows marketers to spend less time preparing spreadsheets and more time interpreting results.
6. Always End With an Action
This is one of the most important parts of marketing reporting.
Don’t stop at:
“Conversions decreased by 15%.”
Ask:
Why did they decrease?
Then ask:
What should we change?
That is the difference between reporting data and using analytics for decision-making.
What Should a MarTech Dashboard Include?
A dashboard should be designed around the person using it.
An executive does not necessarily need the same information as a campaign manager.
Executive Dashboard
An executive-level dashboard could include:
- Marketing spend
- Leads
- Pipeline
- Revenue
- Customer acquisition cost
- Marketing ROI
Campaign Dashboard
A campaign manager may need:
- Campaign spend
- Impressions
- Clicks
- Conversions
- Cost per lead
- Cost per acquisition
- Revenue
Website Dashboard
A website-focused dashboard could track:
- Visitors
- Traffic sources
- Landing pages
- Engagement
- Conversions
- Important events
Customer Journey Dashboard
A customer journey dashboard could show:
- Major touchpoints
- Journey stages
- Conversion rates
- Drop-off points
- Repeat interactions
The best dashboard is not the one with the most charts.
It’s the one that makes important information easy to understand.
Common MarTech Analytics Mistakes
Even businesses with advanced MarTech platforms can struggle with analytics.
Measuring Everything
Tracking hundreds of metrics does not necessarily create better insights.
Too much information can make important signals harder to see.
Focusing on Vanity Metrics
Traffic, impressions, and followers can be useful, but they should not become the only definition of marketing success.
Always connect them to meaningful outcomes.
Ignoring Data Quality
If your tracking is incorrect, your reports will be incorrect too.
Regular tracking audits are essential.
Working With Siloed Data
When marketing, sales, and customer data remain separated, it becomes difficult to understand the full customer journey.
Relying on One Attribution Model
No single attribution model can explain every customer decision.
Use attribution as one part of a broader measurement strategy.
MarTech Analytics and Customer Experience
Analytics is not only about measuring campaigns.
It can also help improve customer experience.
Suppose analytics shows that many visitors repeatedly visit a pricing page but leave without contacting sales.
That pattern may indicate that customers have unanswered questions.
The business could respond by adding:
- Clearer pricing information
- FAQs
- Product comparisons
- Customer testimonials
- A better contact option
In this way, analytics becomes more than a reporting tool.
It becomes a way to identify friction in the customer journey and improve the overall experience.
The Future of MarTech Analytics
Marketing analytics will continue to evolve as technology, customer expectations, and privacy requirements change.
Several areas are likely to become increasingly important.
AI-Assisted Decision Support
AI will help marketers analyze larger datasets and identify patterns faster.
Predictive Marketing
Instead of only asking what happened, marketers will increasingly ask what is likely to happen next.
Connected Customer Data
Marketing, sales, customer experience, and product information will become more closely connected.
Privacy-Aware Measurement
Businesses will need measurement strategies that balance useful insights with responsible data practices.
Real-Time Insights
Marketing teams will increasingly expect systems to highlight important changes quickly rather than waiting for a monthly report.
The overall direction is clear.
Marketing analytics is moving away from simply reporting the past and toward helping teams make better decisions about the future.
Frequently Asked Questions
What is MarTech analytics and reporting?
MarTech analytics and reporting is the process of collecting and analyzing marketing data from CRM platforms, website analytics, advertising systems, email platforms, and marketing automation tools. It helps businesses understand marketing performance, customer behavior, and conversions.
Why is MarTech analytics important for businesses?
MarTech analytics helps businesses identify which marketing activities are producing results and where improvements are needed. It also helps teams reduce wasted spending and make better data-driven decisions.
Which metrics should marketers track with MarTech analytics?
Important metrics can include conversion rate, qualified leads, customer acquisition cost, customer lifetime value, campaign performance, revenue, and return on marketing investment.
How can businesses improve their MarTech reporting?
Businesses can improve reporting by defining clear goals, selecting useful KPIs, connecting marketing and CRM data, maintaining accurate tracking, automating reports, and turning insights into practical marketing actions.