







A QR code on a product package, printed advertisement, or event poster can do more than direct someone to a website. It can help businesses understand how people respond to their marketing campaigns.
Imagine distributing hundreds of brochures to potential customers. You know how many brochures were printed, but do you know how many people actually showed interest? Without a way to measure engagement, it can be difficult to understand whether the campaign delivered meaningful results.
This is where QR code campaign analytics becomes useful. By connecting printed materials with trackable digital destinations, marketers can learn which campaigns attract attention, how visitors interact with online content, and whether those interactions lead to valuable actions.
For businesses that use both traditional and digital marketing, this approach provides a practical way to make campaign performance easier to measure.
What Is QR Code Campaign Analytics?
QR code campaign analytics is the process of measuring interactions with QR codes used in marketing campaigns. It helps businesses understand how customers move from offline materials to online platforms.
For example, a company promoting a new product might place QR codes on packaging, brochures, and retail displays. Each code can direct customers to a relevant product page while using separate tracking links to identify the source of website traffic.
Marketers can then examine scan reports, website visits, engagement, and conversions, depending on the tools they use.
The important distinction is that a scan does not automatically mean a customer is interested in buying something. Analytics becomes more useful when businesses look at what happens after the scan and whether visitors complete the intended action.
Why QR Code Analytics Matters for Marketers
Offline marketing remains relevant across retail, events, print advertising, and product packaging. However, measuring the direct response to these activities can be challenging.
QR codes offer a simple connection between physical marketing materials and digital experiences. Customers can scan a code with their smartphones instead of typing a website address or searching for information themselves.
This connection provides several advantages:
- Clearer campaign measurement: Businesses can track scan activity and connect it with website data when tracking is configured correctly.
- Better customer experiences: A scan can take customers directly to a product page, registration form, video, or special offer.
- More informed marketing decisions: Campaign comparisons help identify which placements deserve further testing.
- Improved performance analysis: Marketers can examine whether visitors take meaningful actions after reaching the website.
Rather than relying entirely on assumptions, businesses can use campaign data to understand what attracts attention and where improvements may be needed.
Key Metrics to Track in QR Code Campaigns
Counting scans is a useful starting point, but it does not tell the whole story. Marketers should consider several measurements when evaluating campaign performance.
1. Total Scans
Total scans show how frequently a QR code has been scanned during a particular period. This can help marketers understand the level of interaction with a campaign.
However, one person may scan the same code several times. Scan totals should therefore not be treated as an exact count of individual people.
2. Website Visits
Website analytics can help identify visits associated with a QR code campaign when the destination URL contains suitable tracking parameters.
For instance, a business could compare traffic from an event banner with traffic from printed brochures. This comparison helps show which marketing placements bring more visitors to the website.
3. Conversion Rate
A conversion happens when a visitor completes a desired action, such as purchasing a product, registering for an event, downloading a resource, or submitting a form.
A simple scan-to-conversion calculation is:
Conversion Rate = (Conversions ÷ Scans) × 100
Suppose a campaign receives 800 scans and generates 40 registrations. Its scan-to-registration rate is 5%.
This figure helps marketers evaluate whether the campaign encourages people to take the next step. For accurate reporting, the team should define the conversion event clearly and account for the limitations of comparing scans with website conversions.
4. Landing Page Engagement
The experience after scanning is just as important as the scan itself.
Visitors might read an article, explore product details, watch a demonstration, or leave without interacting further. Website analytics can help marketers examine engagement time, engaged sessions, page views, and completed actions.
If visitors arrive but rarely continue, the landing page may need clearer messaging, more relevant information, or a smoother mobile experience.
5. Campaign Placement Performance
A QR code displayed at a trade show may perform differently from one printed on product packaging or placed inside a store.
Using separate tracking links for these placements makes comparison easier. Marketers can identify patterns in campaign performance and use those insights when planning future activities.
How to Set Up QR Code Campaign Tracking
A useful tracking system starts with a clear plan. The following steps can help businesses measure their campaigns more consistently.
Step 1: Set a Clear Campaign Goal
Decide what the campaign should achieve before creating the QR code. The objective might be increasing website traffic, generating leads, encouraging registrations, or supporting product sales.
A clear goal helps determine which metrics matter most.
Step 2: Add Tracking Parameters to the URL
Use a relevant landing page and add UTM parameters to its URL. These parameters help analytics platforms identify the source, medium, and campaign associated with incoming traffic.
For example:
In this example, the brochure is the source, offline is the medium, and product launch is the campaign name.
Replace the example URL with the actual destination page. Use consistent campaign naming so that reports remain organized and easy to compare.
Step 3: Create and Test the QR Code
Generate a QR code using the tracked URL or a suitable QR code platform.
Before printing it, test the code on different smartphones. Confirm that it opens the correct page, scans easily, and works as expected.
It is also worth checking the landing page on mobile devices. A difficult-to-read page or a broken link can reduce the value of an otherwise effective campaign.
Step 4: Configure Analytics
Connect the campaign with a website analytics platform, such as Google Analytics 4, and configure relevant conversion events.
If you need direct scan counts, select a QR code platform that offers scan reporting. QR code scans and website visits measure different activities, so their totals may not match.
Step 5: Review the Results
Monitor campaign performance throughout its duration. Compare scans, website engagement, and conversions against the original objective.
Use the findings to identify successful placements, investigate weak results, and test improvements. Regular analysis makes it easier to learn from one campaign and apply those lessons to the next.
Practical Example: A Retail QR Code Campaign
Consider a retail brand introducing a new skincare product. The company places QR codes on product packaging, in-store displays, and promotional leaflets. Each placement uses a separate tracking link.
After the campaign, the team records the following illustrative results:
| Marketing placement | Scans | Purchases |
|---|---|---|
| Product packaging | 600 | 30 |
| In-store displays | 900 | 36 |
| Promotional leaflets | 500 | 15 |
| Total | 2,000 | 81 |
The campaign receives 2,000 scans and records 81 purchases. The overall purchase-to-scan ratio is 4.05%.
In-store displays generate the most scans, while product packaging has the highest purchase-to-scan ratio at 5%.
These numbers give the marketing team a useful starting point. The team might test a different message on the in-store display, improve the product page, or investigate why customers respond differently to each placement.
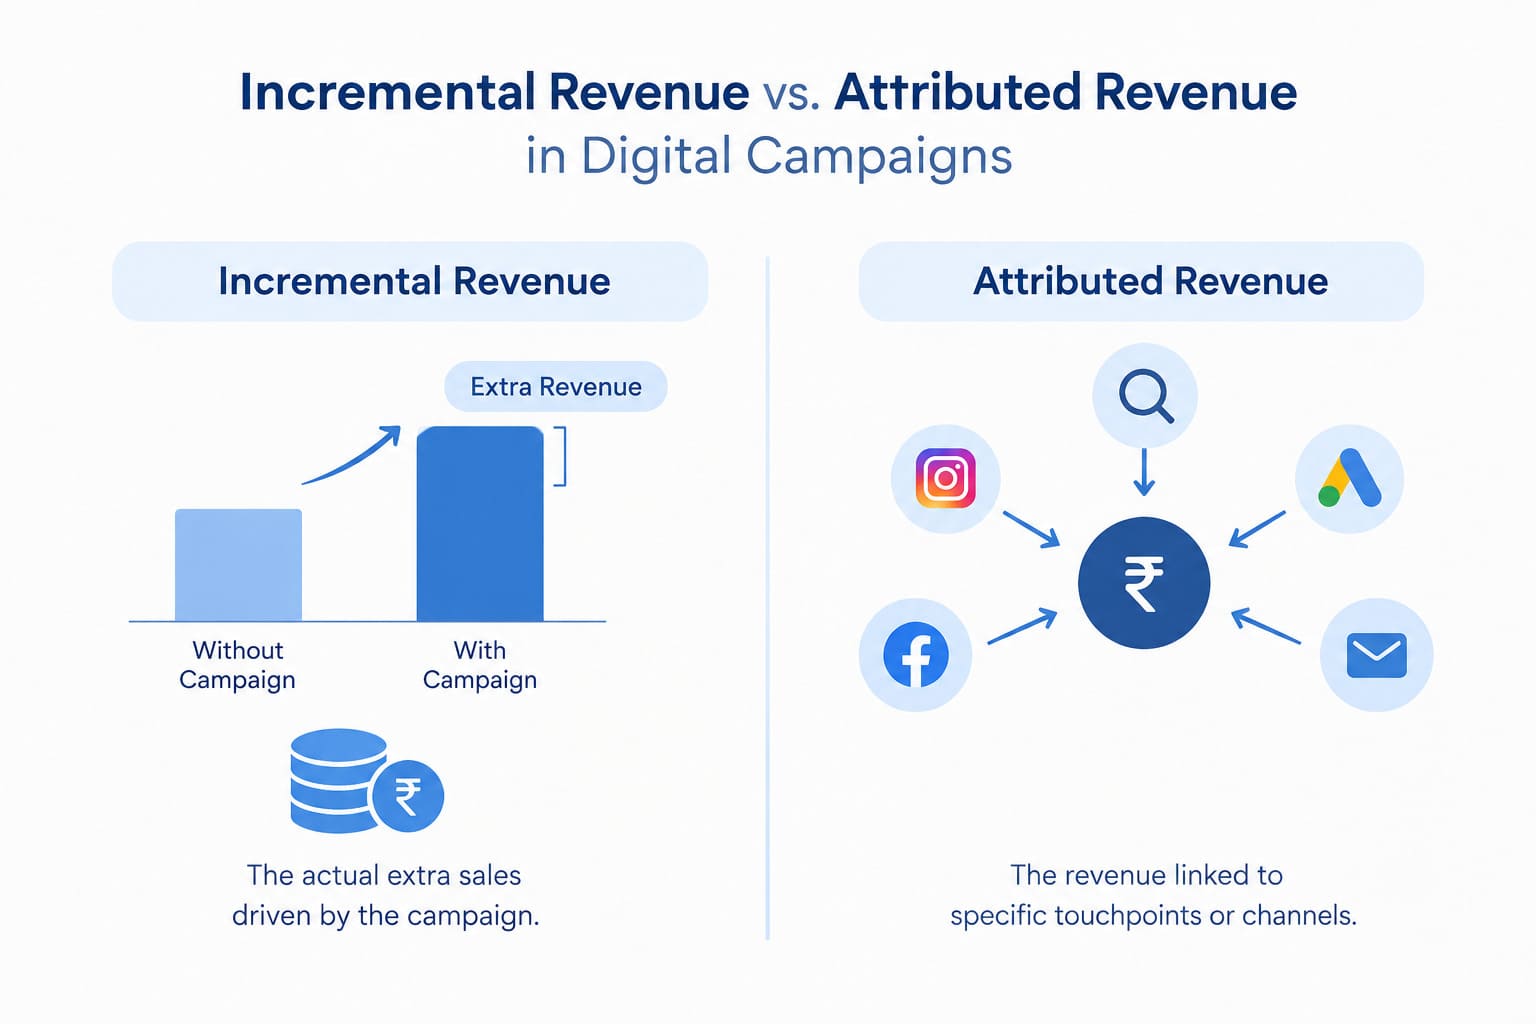
The results should be interpreted carefully. A purchase may involve several marketing touchpoints, so these figures alone do not prove that every sale was caused by a QR code scan.
Common Challenges in QR Code Campaign Analytics
Although QR codes make campaign tracking more accessible, some issues can affect the quality of the data.
Inconsistent campaign naming: Different UTM formats can split traffic across multiple reports and make comparisons difficult.
Repeated scans: Scan counts may include several interactions from the same person.
Differences between tracking tools: QR code platforms and website analytics systems may report different totals because of redirects, connection problems, privacy settings, or blocked tracking.
Poor mobile experiences: Slow pages, unclear content, and complicated forms can discourage visitors from continuing.
Attribution limitations: Someone who scans a code may complete a purchase later through a different channel.
Privacy requirements: Businesses should handle tracking data responsibly and follow applicable privacy laws and consent requirements.
Understanding these limitations helps marketers avoid misleading conclusions and make better use of the information available.
Best Practices for Better QR Code Campaigns
A QR code works best when customers understand why they should scan it and receive something relevant in return.
- Use a clear call to action. Tell customers what they can expect, such as product details, an event registration page, or a useful guide.
- Match the destination to the message. A product advertisement should lead to relevant product information rather than an unrelated homepage.
- Use separate tracking links where needed. This makes it easier to compare different campaign placements.
- Keep landing pages mobile-friendly. Ensure that content loads quickly and important information is easy to find.
- Measure meaningful actions. Track registrations, purchases, downloads, or other outcomes that match the campaign goal.
- Test and improve. Experiment with placement, messaging, and page design to identify what works better.
- Respect customer privacy. Collect appropriate data and explain tracking practices where required.
These steps help connect campaign measurement with a better experience for the customer.
The Future of QR Code Campaign Analytics
QR code analytics can become even more useful when campaign data is connected with other marketing systems. For example, businesses may combine website analytics with customer relationship management platforms to understand whether an offline interaction contributes to a later lead or sale.
Imagine someone scanning a QR code at a business conference to access a research report. If the person voluntarily registers for additional information, the company may be able to measure whether that interaction later contributes to a qualified lead.
Marketing automation can also help teams organize campaign reports, compare results, and identify changes in engagement.
Still, collecting more data is not the main objective. The real value lies in collecting appropriate information, interpreting it correctly, and using it to improve marketing decisions.
Conclusion
QR code campaign analytics helps businesses understand how offline marketing connects with online engagement. By tracking scans, measuring website activity, evaluating conversions, and comparing campaign placements, marketers can gain a more practical view of their marketing performance.
Successful tracking requires clear objectives, consistent URL parameters, reliable analytics tools, and relevant landing pages. It also requires an understanding of the difference between a scan, a website visit, and a completed conversion.
When used thoughtfully, QR codes turn printed materials into measurable digital touchpoints. The insights they provide can help marketers improve campaign experiences, understand audience responses, and plan future marketing activities with greater confidence.
Frequently Asked Questions
1. What is QR code campaign analytics?
QR code campaign analytics measures scans and helps marketers understand website traffic, visitor engagement, and conversions generated through QR code campaigns.
2. How can marketers track QR code campaigns?
Marketers can use trackable QR codes, UTM parameters, and website analytics tools to measure campaign traffic and evaluate user actions.
3. Which metrics are important for QR code campaigns?
Important metrics include total scans, website visits, conversion rates, landing page engagement, and performance across different campaign placements.
4. How do QR codes improve offline marketing measurement?
QR codes connect printed materials with digital destinations, allowing businesses to measure interactions and understand how offline campaigns contribute to online engagement.